
How to use the histogram for landscape photography
What is a histogram?
A histogram is a graph that shows the distribution of tones within an image. Most DSLR and mirrorless cameras have the ability to display a histogram through either the viewfinder or the rear LCD screen. The graph shows the darkest tones to the left, the brightest to the right and mid-tones, as you would expect, in the middle. You will see the graph rise depending on the number of tones within that particular area of the graph.
So if you took a photograph of a black piece of card you should have all of the tones on the histogram stacked to the very left in one line as shown in the example below.

The Same if you took a photo of a white piece of card. As shown below.

How should a histogram look for a photo?
So the histogram is a fantastic tool for gaining the correct exposure for an image. Quite often I rely solely on the histogram to give me an exact representation of a scene, it is particularly useful when bright sunlight is hitting the LCD and it is difficult to see the image clearly.
So how should the histogram look for a photo?
Well, to be honest, there isn't a definitive answer here, but there are some golden rules to follow.
Firstly, you do not want the histogram to be pushed to either edge of the graph as this will mean that you are losing detail in the shadows or highlights.
histogram pushed to the left

histogram pushed to the right
In landscape photography, you often hear the term protecting the highlights and the histogram will show you this. I always like to leave a little gap between the end of the graph and the start of my tones, this ensures that no detail will be lost.
I would say it is more pleasing to the eye to lose detail in your shadows than your highlights.
So now we know not to bunch the graph to the right, how should the rest of the histogram look?
The answer simply depends on the tonal range of the image. For example, if you are shooting a scene with mainly green fields that are evenly lit then you may see the graph evenly spread through the middle of the histogram. If the scene has a very large dynamic range, for example, a dark woodland and a bright sky we may see the graph spread out across the whole of the histogram, in extreme cases bunched towards each side with little in the middle. I really do not think there is such a thing as a perfect histogram. but one that doesn't reach either edge is ideal.
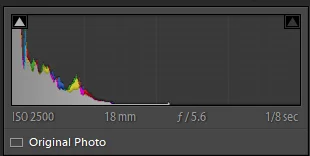
Below is a properly exposed histogram with no loss of detail.

What does clipping mean in photography?
Clipping refers to the loss of detail in either the shadows or highlights of a photograph, you may also hear the terms, clipping the blacks or blowing the highlights. Definitely, something to avoid.
Let's get technical, well a little bit...
Let's just dive into how the histogram is put together.
When you meter for a scene the camera will evaluate the tonal range within the image and show the number of pixels stacked on top of each other for that particular luminance value.
So the y-axis that runs from top to bottom represents the number of pixels per luminance value.
The x-axis represents the different shades of grey 0 on the left, which is pure black and 255 on the right which is pure white. This means the luminance will get lighter the further we move along the graph from left to right. If we take an image with the lens cap on, the histogram will show one line of pixels stacked on top of each other at the 0 end of the graph-pure black.

Problems with the histogram and how to avoid them.
Generally, I will shoot images with a raw and a jpeg back up. Shooting in raw is always advisable as you will be able to pull more detail from your image when post-processing.
One thing to look out for is how the histogram is displayed. For most cameras, the histogram will be a representation of the jpeg profile that you are shooting in. So if you are shooting in a vivid or a landscape profile you will see that the jpeg will have a lot more saturation and contrast compared to the raw file of the same image.
So why does this matter?
The histogram will be a representation of the jpeg profile, meaning it will be showing more contrast than that of the same raw file. Meaning the histogram will look completely different from that of the raw file. So when you are exposing the histogram for the jpeg file you will not be looking at an accurate graph. It is advisable to select a relatively flat jpeg profile to shoot in. Something that is closer to how the raw file looks. Standard or neutral is a good starting point. My cameras also allow me to adjust the shadows and highlights, so I turn these down to negative 1 which also helps. This doesn't affect the raw file just that of the jpeg which is being displayed and that of which the histogram is built around.
You will find a very good example of this in my video below - 3 histogram tips.
Check your RGB
Most histograms display the grey scale which is worked out as an average over the 3 colour channels, red, green and blue. So if you have a tricky exposure with a lot of red in your image it is definitely worth bringing up your RGB histogram and checking that as well. Sometimes one channel can be clipping and it doesn't show in the grayscale version, so always worth a quick look if your camera supports it.
Expose to the right?
You may have heard the term expose to the right and how this can improve your overall image quality, while I agree with this to some degree it isn't always advisable. Exposing to the right means pushing your histogram to the right-hand side of the graph as much as possible before clipping happens.
The benefits of exposing to the right are, that if your shadows are lighter then there will be a lot more detail in them. so you can darken the shadows in post-production to make them look correct. You will then have very noise free, highly detailed shadow areas. If your shadows are underexposed or darker, increasing them in post-production will add a lot of noise and they will show a lot less detail.
So why not expose to the right all of the time?
Well, you need to look at the scene you have in front of you. If the scene is of a dark woodland then it's natural the graph will be to the left. If the sky isn't included then the graph might not meet halfway. If we pushed the graph all the way to the right we would be massively overexposing and then colours start to get oversaturated and things get a little weird, sometimes this is impossible to correct in post. So ideally try to look at the scene think where the histogram should be and try to expose the image as you imagine the histogram to look. For example, if you take an image of a black wall and the pushed the histogram to the right, the image would no longer be black it would be a light grey. So just be wary of this.
What to do when the histogram reaches both edges and the highlights and shadows are clipping?

Each camera will have a dynamic range in which it can display an image without losing detail. My cameras are around 12 stops of light. If the dynamic range of a scene is more than this, the histogram will be clipping at either side of the graph meaning we will need to take multiple images with different exposure values. This is referred to as bracketing. The other option is to use a graduated filter to reduce the exposure in certain areas of the frame. Recomposing can often help too.
Conclusion.
A histogram is a fantastic tool. I rely on it almost every time I am on a shoot. So if your camera supports it, put it on your LCD and make the most of its capabilities.
As an Amazon Associate I earn from qualifying purchases.


